Operational indicators
| 03/31/2023 (FY) | 06/30/2023 (T1) | 09/30/2023 (S1) | 12/31/2023 (9 months) | |
| Utilization rate | 73% | 73% | 73% | 73% |
| Average daily rate | € 890 | € 896 | € 900 | € 898 |
| Order Book | 4.0 months | 4.2 months | 3.6 months | 4.2 months |
| Headcounts | 4,406 | 4,348 | 4,305 | 5,764 |
Simplified income statement
| (€m) | 2022/23 | 2021/22 | VARIATION |
| Revenue | 532.3 | 470.1 | +13% |
| Operating profit on ordinary activities | 77 | 74.8 | +3% |
| Operating margin on ordinary activities | 14.5% | 15.9% | |
| Operating profit | 72.7 | 72.8 | +0% |
| Net profit, group share | 50.1 | 51.0 | -2% |
| Net margin | 9.4% | 10.9% |
| (€m) | H1 2022/23 | H1 2022/23 | VARIATION |
| Revenue | 276.7 | 237.1 | +17% |
| EBIT | 36.8 | 29.7 | +24% |
| EBIT margin | 13.3% | 12.5% | |
| Operating profit | 33.2 | 25.7 | +29% |
| Group share of net income | 23.0 | 17.9 | +28% |
| Net margin | 8.3% | 7.6% |
Summary cash flow statement
| (€m) | 2022/23 | 2021/22 |
| Self-financing capacity before net financial debt and tax expenses | 83.8 | 79.0 |
| Net cash flow from operating | 41.1 | 56.3 |
| Net cash flow from investments | (52.7) | (12.5) |
| Net cash flow from financing operations | (25.8) | (24.0) |
| Change in cash & equivalents | 37.4 | 19.9 |
| (€m) | H1 2022/23 | H1 2022/23 |
| Self financing capacity before net financial debt and tax costs | 39.4 | 30.1 |
| Change in working capital | (20.3) | (25.4) |
| Net cash flow from operating activities | 9.3 | (7.5) |
| Net cash flow from investing activities | (6.5) | (52.1) |
| Net cash flow from financing activities | (19.7) | (21.1) |
| Change in cash & equivalents | (16.9) | (80.8) |
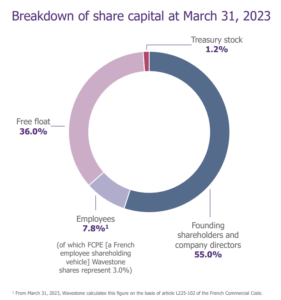
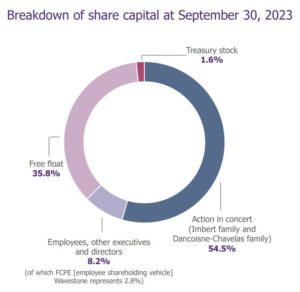
Breakdown of share capital
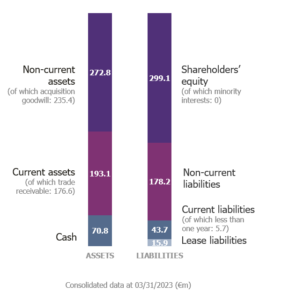
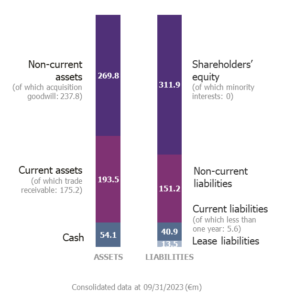
Balance sheet